Breaking News


Popular News


Your Guide to Sovereignty

Following random investment recommendations on social media is a recipe for failure in the cryptocurrency world. To help you filter out all the noise, I'll show you how to find and read on-chain analysis tools to extract valuable information and evaluate investor behavior and market cycles.
In this article, you'll understand:
On-chain analyses are studies that take into account blockchain data, such as:
Unlike traditional technical analysis (which looks only at price and volume and looks for patterns), on-chain analysis observes what market participants are doing on the Bitcoin mainnet.
On-chain analysis does not disregard external factors such as price. In fact, the BTC price is taken into account in various charts to estimate whether investors are in profit, how much revenue miners are generating, among other things.
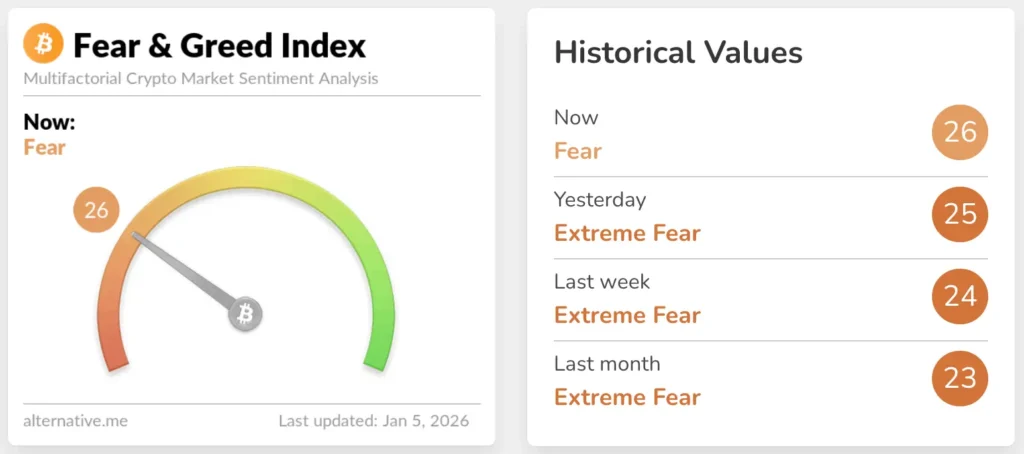
Some analyses, such as the famous “Fear and Greed Index”, even takes into account demonstrations on social networks and Google searches through Google Trends.
All this data can be useful for
On the other hand, they are based exclusively on the transactions recorded on the blockchain, on-chain analysis may not capture relevant events that occur outside the core network - such as internal transactions on exchanges, movements of large funds or transactions on second layer solutions.
For this reason, many analysts choose to integrate off-chain data with on-chain data, building more complete and contextualized analyses of the market.
Today there are several platforms that aggregate and interpret on-chain data. Some of the best known are:
This indicator measures general market sentiment, ranging from:
This tool combines different metrics to estimate the prevailing market sentiment:
Historically, periods of extreme fear tend to coincide with more attractive price regions for long-term purchases.
MVRV stands for Market Value to Realized Value and represents the ratio between Bitcoin's current market value and its realized value, i.e. the average price actually paid by investors. For this calculation, the “cost” of each coin is considered to be the price of BTC at the time it was last moved on the blockchain.
A common interpretation is that:
This is one of the most widely used indicators to identify cycle bottoms and tops.
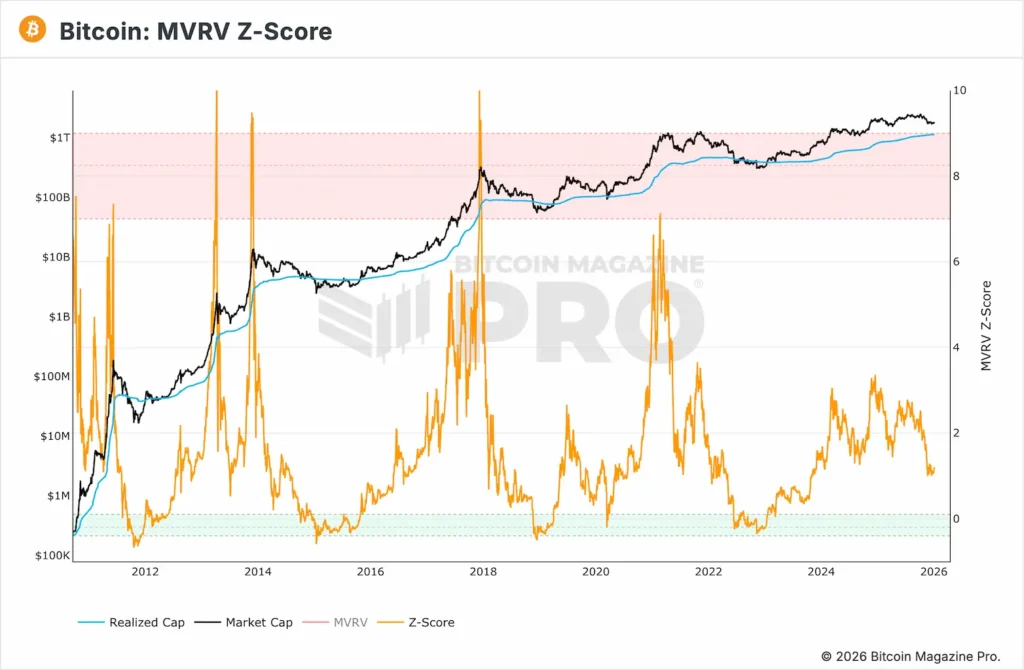
Visually, the indicator highlights red regions where the BTC price tends to be stretched, while the green points to areas where the price has been historically low.
The Realized Price, or simply realized price, represents the average purchase price of all bitcoins in circulation. It is used in the Z-Score formula in the previous graph.
The Realized Price is calculated by dividing the Realized Cap (aggregate value of all coins at the price of the last movement) by the number of bitcoins in circulation.
In practice, when the Realized Price is below the current BTC price, This would indicate that the majority of investors are in profit. On the other hand, when Realized Price is above market price, This means that most of the participants would be operating at a loss.
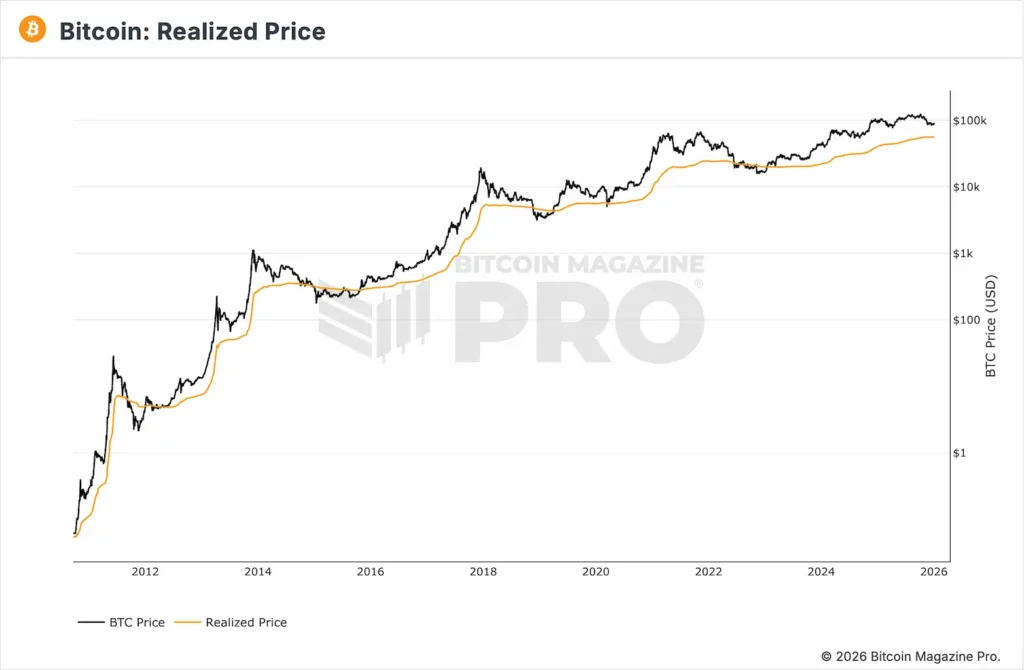
The rare moments when the BTC price fell below the realized price line marked the market's biggest lows. In other words, unique buying opportunities for those with money and courage at a time of investor capitulation.
To conclude the examples of on-chain indicators (remembering that there are many others), it is worth highlighting one that takes Bitcoin mining directly into account.
O Puell Multiple is based on the premise that miners need to sell part of their coins on the market in order to pay for their operations (equipment and electricity) and therefore the revenue they generate tends to influence the BTC price.
The indicator is the result of dividing the daily issue value of bitcoins (in dollars) by the 365-day moving average of the daily issue value.
In other words, the Puell multiple looks at whether miners' revenues are above or below the annual average.
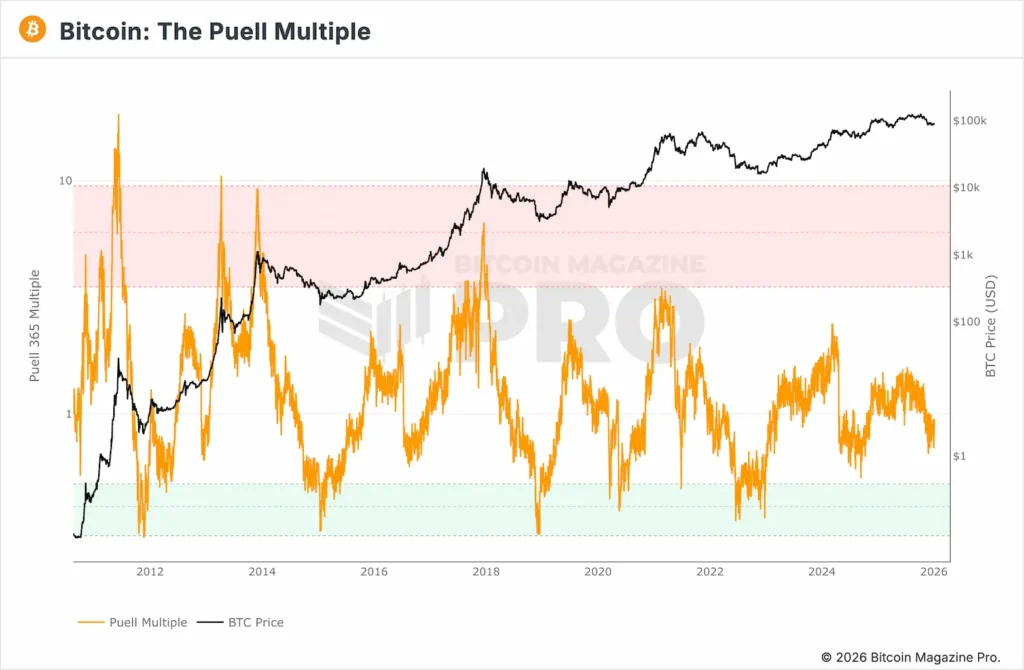
On the graph, the color bands help to contextualize the extremes of the indicator: the red zone signals periods of high revenue for miners, while the green indicates times of historically low revenue.
Okay, you've understood that on-chain data is useful for visualizing Bitcoin market cycles. The problem is that identifying tops and bottoms by looking at the past is no use. The real challenge is to turn this information into better decisions from now on.
One practical application is to integrate on-chain analysis into the DCA strategy, making monthly contributions conditional on the “triggering” of objective criteria defined from your favorite indicators.
THE DCA (Dollar Cost Averaging), for those who don't know it yet, is one of the most widely used strategies for investing in BTC. Given the asset's high volatility, purchases are spread out over time, smoothing out the impact of fluctuations and resulting in an average price between highs and lows.
It consists of buy Bitcoin at fixed intervals (every month, for example), regardless of price or market context.
Advantages:
Disadvantages:
Here the investor also often buys a certain amount, but only in the months when the chosen indicators are in an attractive zone.
It is up to each investor whether they prefer to buy every month, but adjust the size of purchases based on on-chain metrics, or another variation of the strategy.
Advantages:
Disadvantages:
Want to know how this could work in practice? We made a backtest using only the Fear and Greed indicator to find out how much difference the DCA conditioned on the analysis could make. See the results in this thread on X:
On-chain analysis tools are not used to predict short-term movements, but rather to reduce noise, emotion and impulsive decisions. They help investors understand where the market is likely to be in the cycle by providing objective historical references on price, investor behavior and conditions of fear or euphoria.
Integrating this data into a simple strategy, such as DCA, can be an efficient way of improving the risk-return ratio over time. DCA conditioned by on-chain metrics seeks to allocate more capital at times of greater asymmetry, avoiding excessive purchases in historically tight periods.
At the end of the day, the best strategy is the one you can stick to for years, with clear rules and an awareness of the risks. Planning, study and self-control are essential for any investor, and relying less on short-term narratives is good for your portfolio and your emotions.
Important: nothing here is an investment recommendation. The purpose of the article is purely educational.
Do you want to deepen your understanding of Bitcoin and financial sovereignty? If you have any questions, want to better organize your studies or understand how to use sovereign tools in a practical and safe way, fill in the form below.